MoRoll


for NinjaTrader & TradingView


Know when Momentum is rolling over with the MoRoll watching the momentum on multiple timeframes for you.
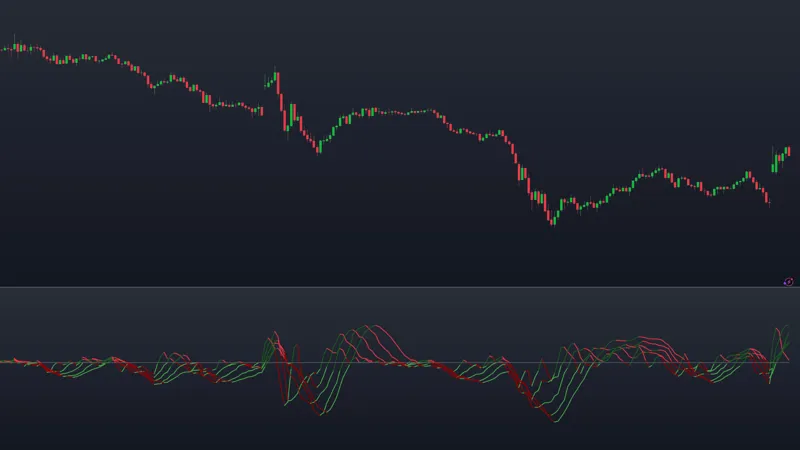
When all rollers are green, momentum is trending bullishly; when red, momentum is trending bearishly. Roller lines will be light green in a weak bull (below the zero line) while dark green is strong bullish. The same goes for red, light red is bearish, but dark red is strong bearish momentum.
You’ll begin to see the lines form under the forming candle and will see the roller bars cycle throughout the day.
This indicator helps you predict when trends are beginning and ending by watching for changes as they begin to roll over.
Spot divergences as the MoRoll trends one way and price trends another.
The MoRoll serves as a confirmation that price is reversing for a reversal trade when rollers begin rolling in the opposite direction. This an help you find confidence in both entries and exits. Enter only when the MoRoll supports a breakout through strong momentum or a reversal as bars roll over. Once in a position, know when the move is confirmed over by the roller lines.
↓ One week trial. ↓
Trading Ranch Membership
Ranch Members get access to indicators
Potentially pays for itself & You can pair it with other indicators for no extra cost!
What is the MoRoll?
The MoRoll is a set of 5 MACD-based lines, each representing a different timeframe. By watching how Momentum is rolling over on lower timeframe charts in addition to the current, we can quickly & visually get an understanding of the underlying Momentum in the market.

How Does It Work?
In TradingView, you will need to set your timeframes. In NinjaTrader, this is done automatically. TradingView will default to 5 minute settings. It’s recommended to use the current timeframe and step down from there. This will limit use on the ultra-low timeframe charts.

TradingView also has an option to show a background fill. Stronger areas of trend will fill more brightly using the colors set for the trends. This option is not currently in NinjaTrader but may be revisited if there is interest.

Both platforms have Settings for MoRoll Line colors, Midline color, Line Width, and Period Length. The formula is the same, but the way the code works in NT8, lower timeframes including the 1 minute will be relatively smooth.

If you have never installed a NinjaTrader Add-On before: First you will need to download the MoRoll .zip file. In NT8, navigate to Tools > Import > NinjaScript Add-On, and follow the prompts to locate and install the file. Then, you will find the MoRoll in your Indicators under “BullBarbieIndicators”.

Once loaded on a chart, you’ll see the rotation cycles the market goes through represented through the MoRoll oscillator. The MoRoll is shown along with MagicLevels in many examples to show how the MoRoll helps put the market into context at Support/Resistance Pivots. It’s almost like the market is “breathing”, inhaling in the up-cycles and exhaling in the down-cycles.

How deep or shallow, along with how gently or abruptly, can offer a lot of clues as to how hard and long the market is pushing, and (more importantly) if that momentum is changing. The pitch, depth, reach, and span are all easy to see — which offers confidence in the heat of the moment when a trader is making a judgement on whether or not to put on the risk of a trade, and when it’s time to close.

The number of Rollers trending Bullishly or Bearishly show agreement (or disagreement) between the timeframes. By using lower timeframes, we get the fastest-reacting indicator possible.
While in a trade, having the Rollers on your side helps offer confidence to hold to full targets, increasing our profit potential.

If Rollers casually roll over one-by-one, we see momentum fading away. This is an ideal time to look for a Reversal entry or to book profits from a trade you have on with the fading trend.

If the Rollers are struggling to hold the Zero line when on an inhaling/bullish cycle, it’s a warning sign to longs to “Get out of the Way” and a “Get Ready” sign to Sellers. Conversely, when Rollers fail to hold below Zero in a market exhale, we’re seeing Buying holding strong (since Selling was not able to “Waterfall” to other timeframes).

The Rollers don’t just offer confirmations of strong or fading trends.
The MoRoll offers confirmations you may already be familiar with from other strategies. Volume Traders will find comfort in seeing confirmations (or divergences) in volume. Strong moves (with strong volume), should also show strong Rollers.
Divergences will also appear, helping traders see when trends are changing.

Rollers that reach much farther to one side of the Zero line are showing a strong trend. The angle of the MoRolls can also show aggression/momentum.

Of course, one of my favorite ways to use the MoRoll is to watch for signs of exhaustion or aggression when price reaches price levels, like the MagicLevels shown here.

If you’d like to watch even more on the MoRoll, keep scrolling for the video below. Otherwise, you’d you like to try the MoRoll for a week for free? You’re welcome to try it along with any other Trading Ranch toys!
↓ One week trial. ↓
Trading Ranch Membership
Ranch Members get access to indicators
Potentially pays for itself & You can pair it with other indicators for no extra cost!

